Issues with graphs with more than 20 rows of data

I’m having a problem with presenting extended datasets, where it seems to pull the first value of the first table and then the 20 values from the next page.

For example, the below is simply a Google Sheet with an array of a single column, the header is “value” and the values are simply 1,2,3-60.

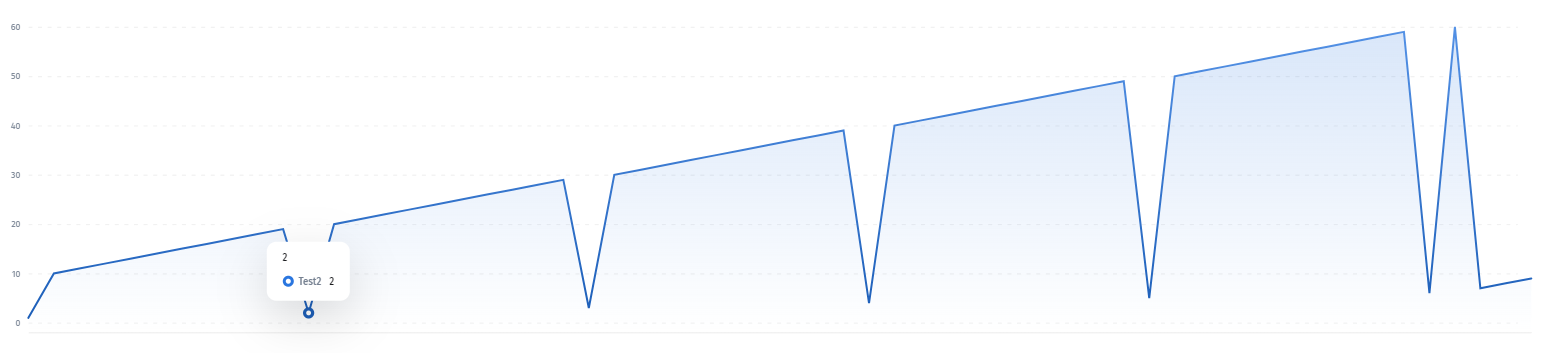
When I create a graph of “Row” vs. “Value”, it doesn’t seem to pull the data in the order in which it’s stored in the table:

What am I doing wrong / is this a bug?

I also had this problem. > 20 seems to break graphs. < 20, data populates.

Hello @aspurlock @alex
Could you please share the page url or dataset so I’ll be able to check it on our side?

For sure. Give me sometime to get one ready.

I’m now having issues with less than 20 data sets

It goes:

Row 1 of data (Row 2 if you include headers)
Row 10
Row 11
Row 12

etc.

@JetTeam is there an update on this issue?

Same issue here. Any updates?

same issue here :frowning: any news?

The initial post shows the problem of data not being sorted correctly when using Number field for X axis. This issue is fixed now.

Please check if works now.

Hello @agaitan026 @hlp-cbruce @Alex @aspurlock Could you please confirm it works fine now?

I can look at this today and let you know :slight_smile:

Is it working for you? Still not working for me.

Have you tried recreating the widget from scratch?

For me it seemingly retained the erroneous output until I created it again from scratch.

@hlp-cbruce @aspurlock @Alex Yup, you should re-create Chart component.